Source register
Paper figure sources
A transparent register of the 15 primary paper-derived visuals used throughout the atlas. Every entry connects the figure, structured guide and original DOI record.
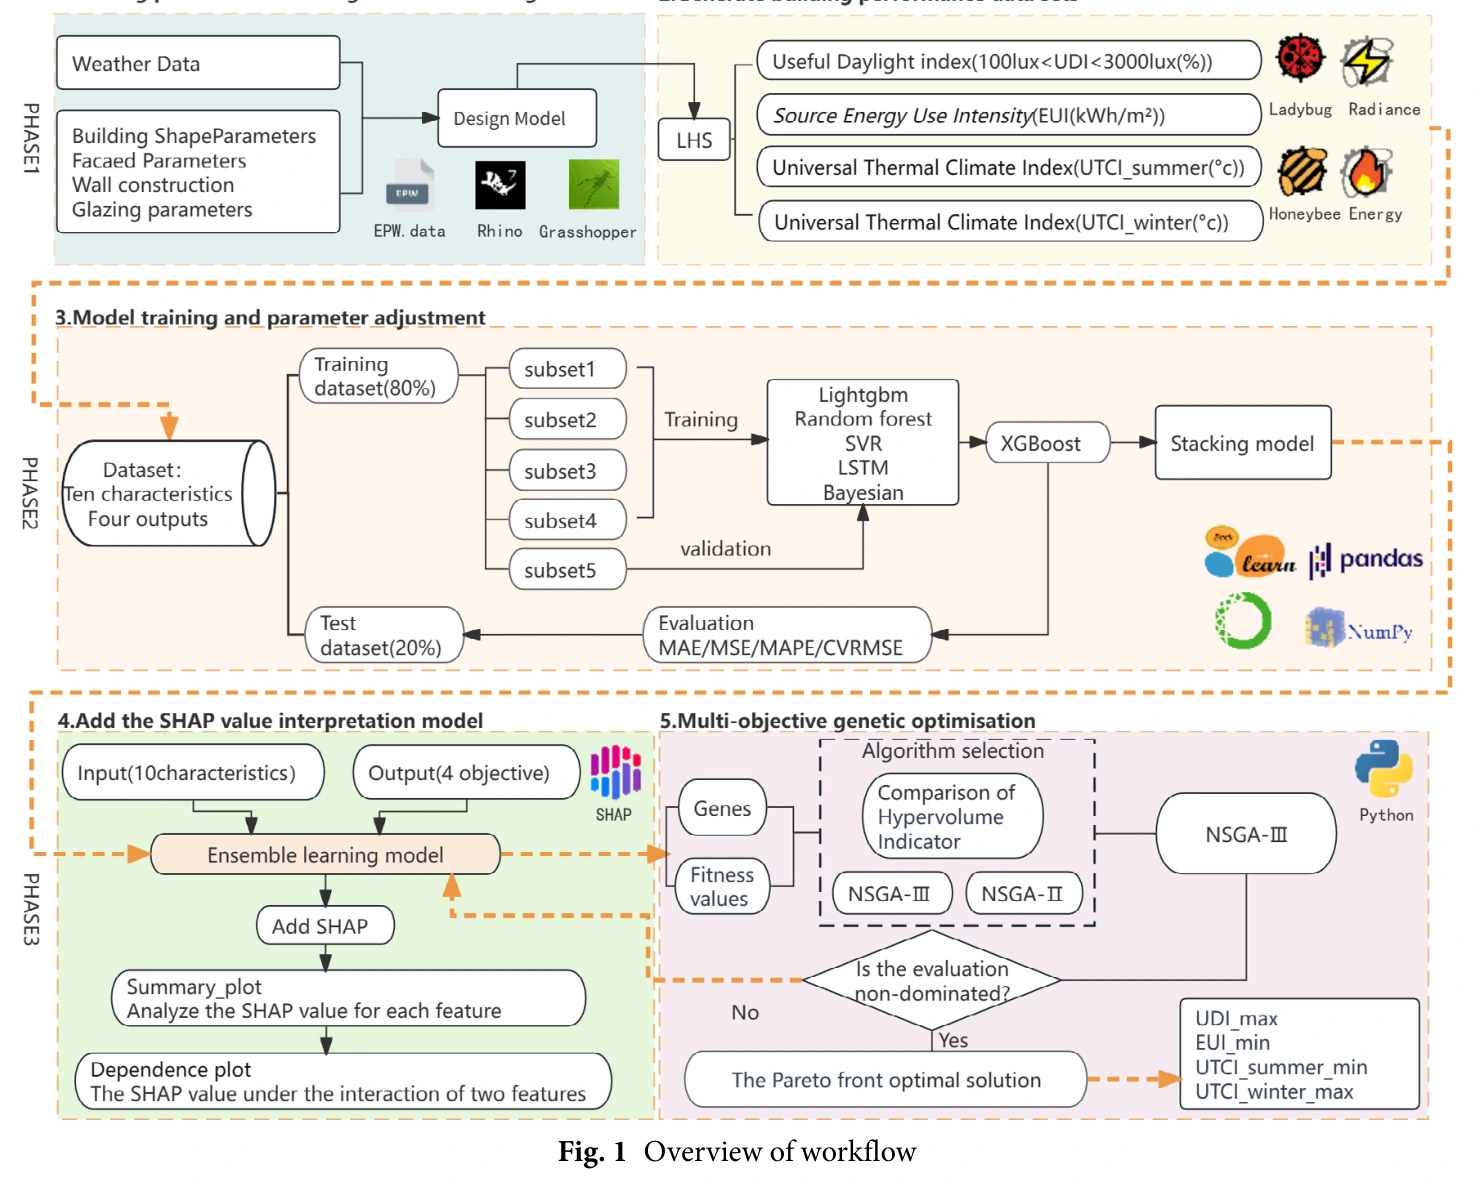
Figure 1. Overview of the study workflow integrating parametric modeling, stacking prediction, SHAP interpretation, and NSGA-III optimization.
Shen et al. · Building Simulation 2024 · DOI 10.1007/s12273-024-1108-7
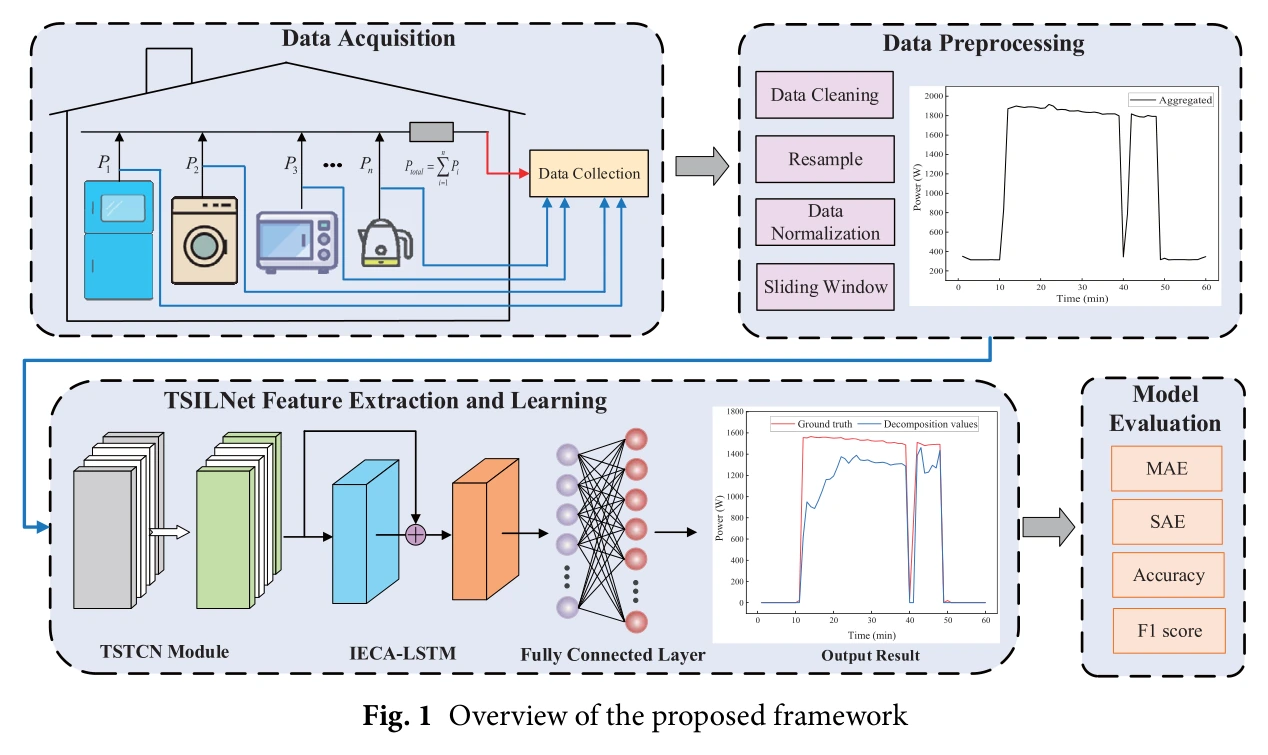
Figure 1. Overview of the proposed TSILNet framework for data acquisition, preprocessing, feature extraction, learning, and model evaluation.
Zhu et al. · Building Simulation 2024 · DOI 10.1007/s12273-024-1175-9
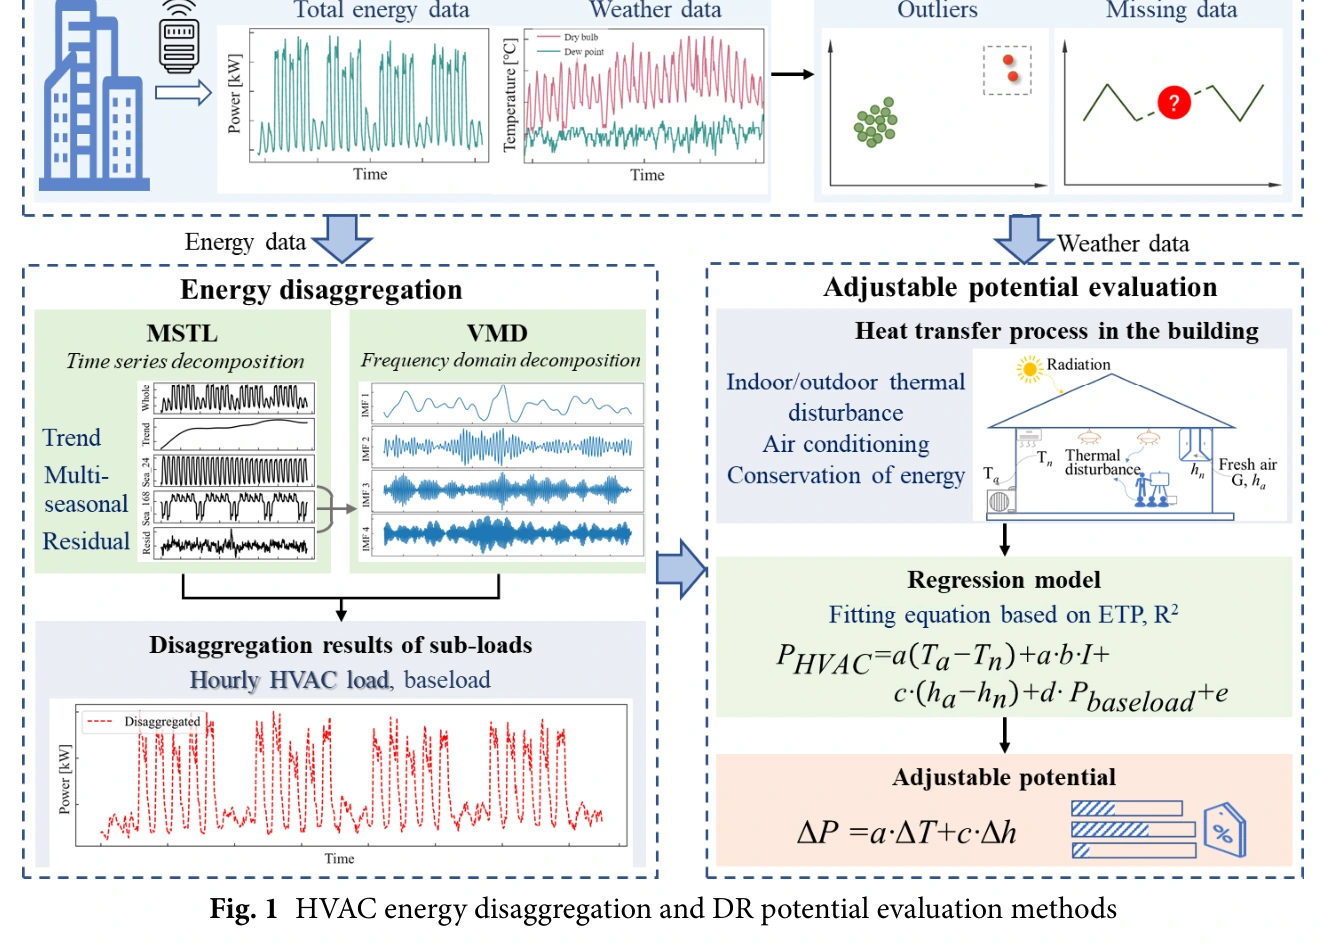
Figure 1. HVAC energy disaggregation and demand-response potential evaluation method based on time-frequency decomposition and regression modeling.
Zhang et al. · Building Simulation 2025 · DOI 10.1007/s12273-025-1367-y
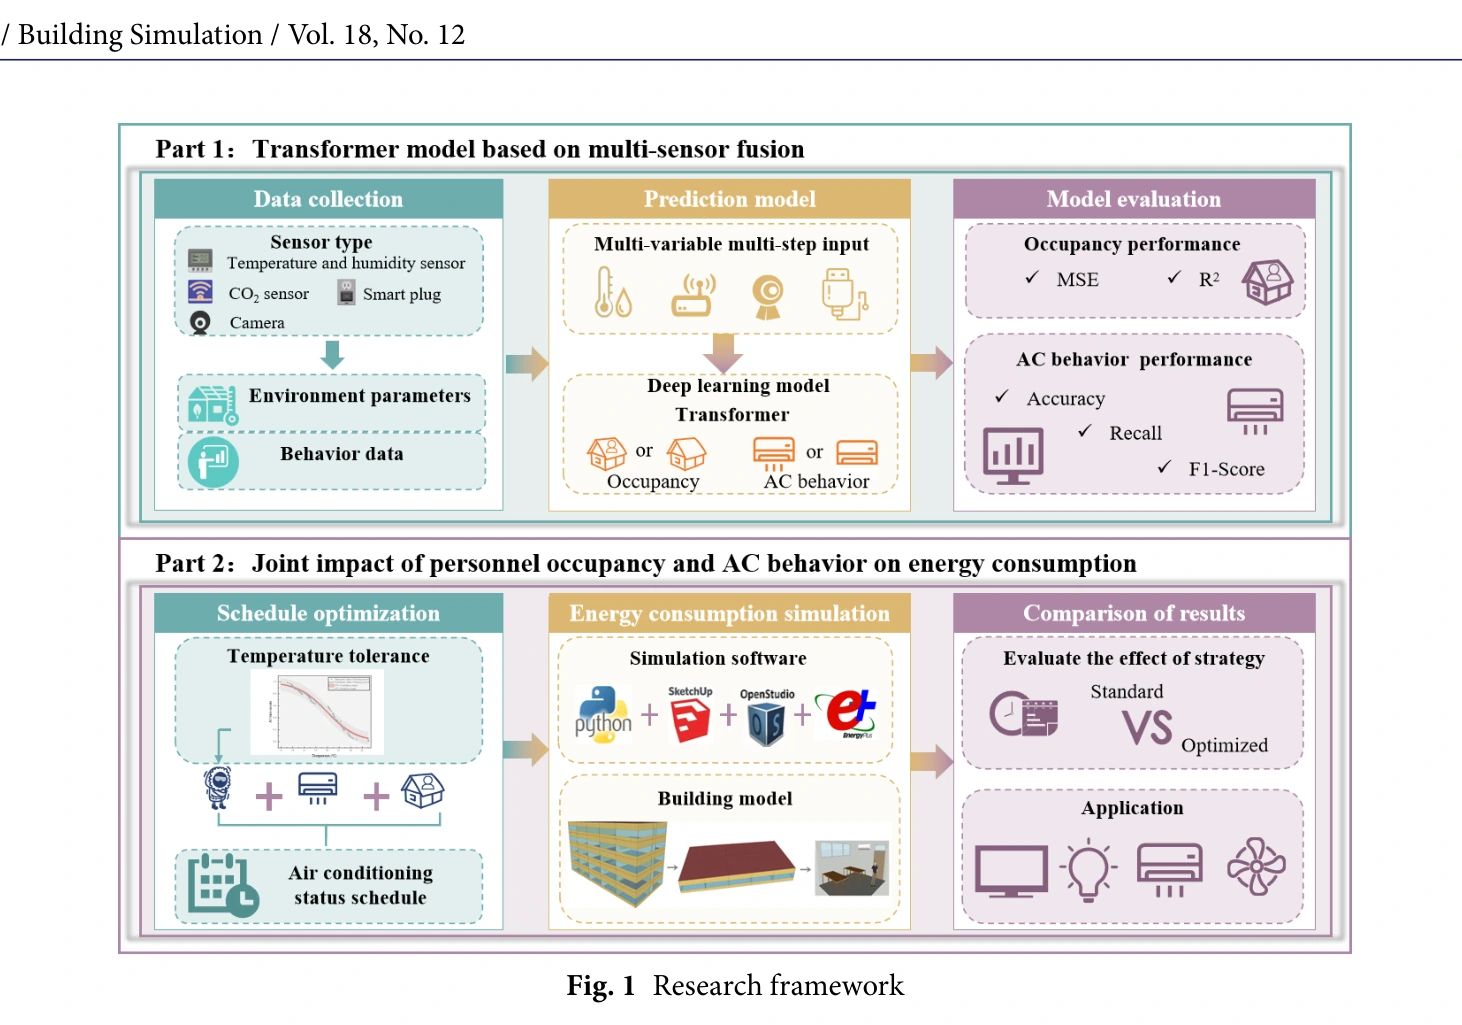
Figure 1. Research framework linking multi-sensor Transformer prediction with AC schedule optimization and energy-consumption simulation.
Yu et al. · Building Simulation 2025 · DOI 10.1007/s12273-025-1356-1
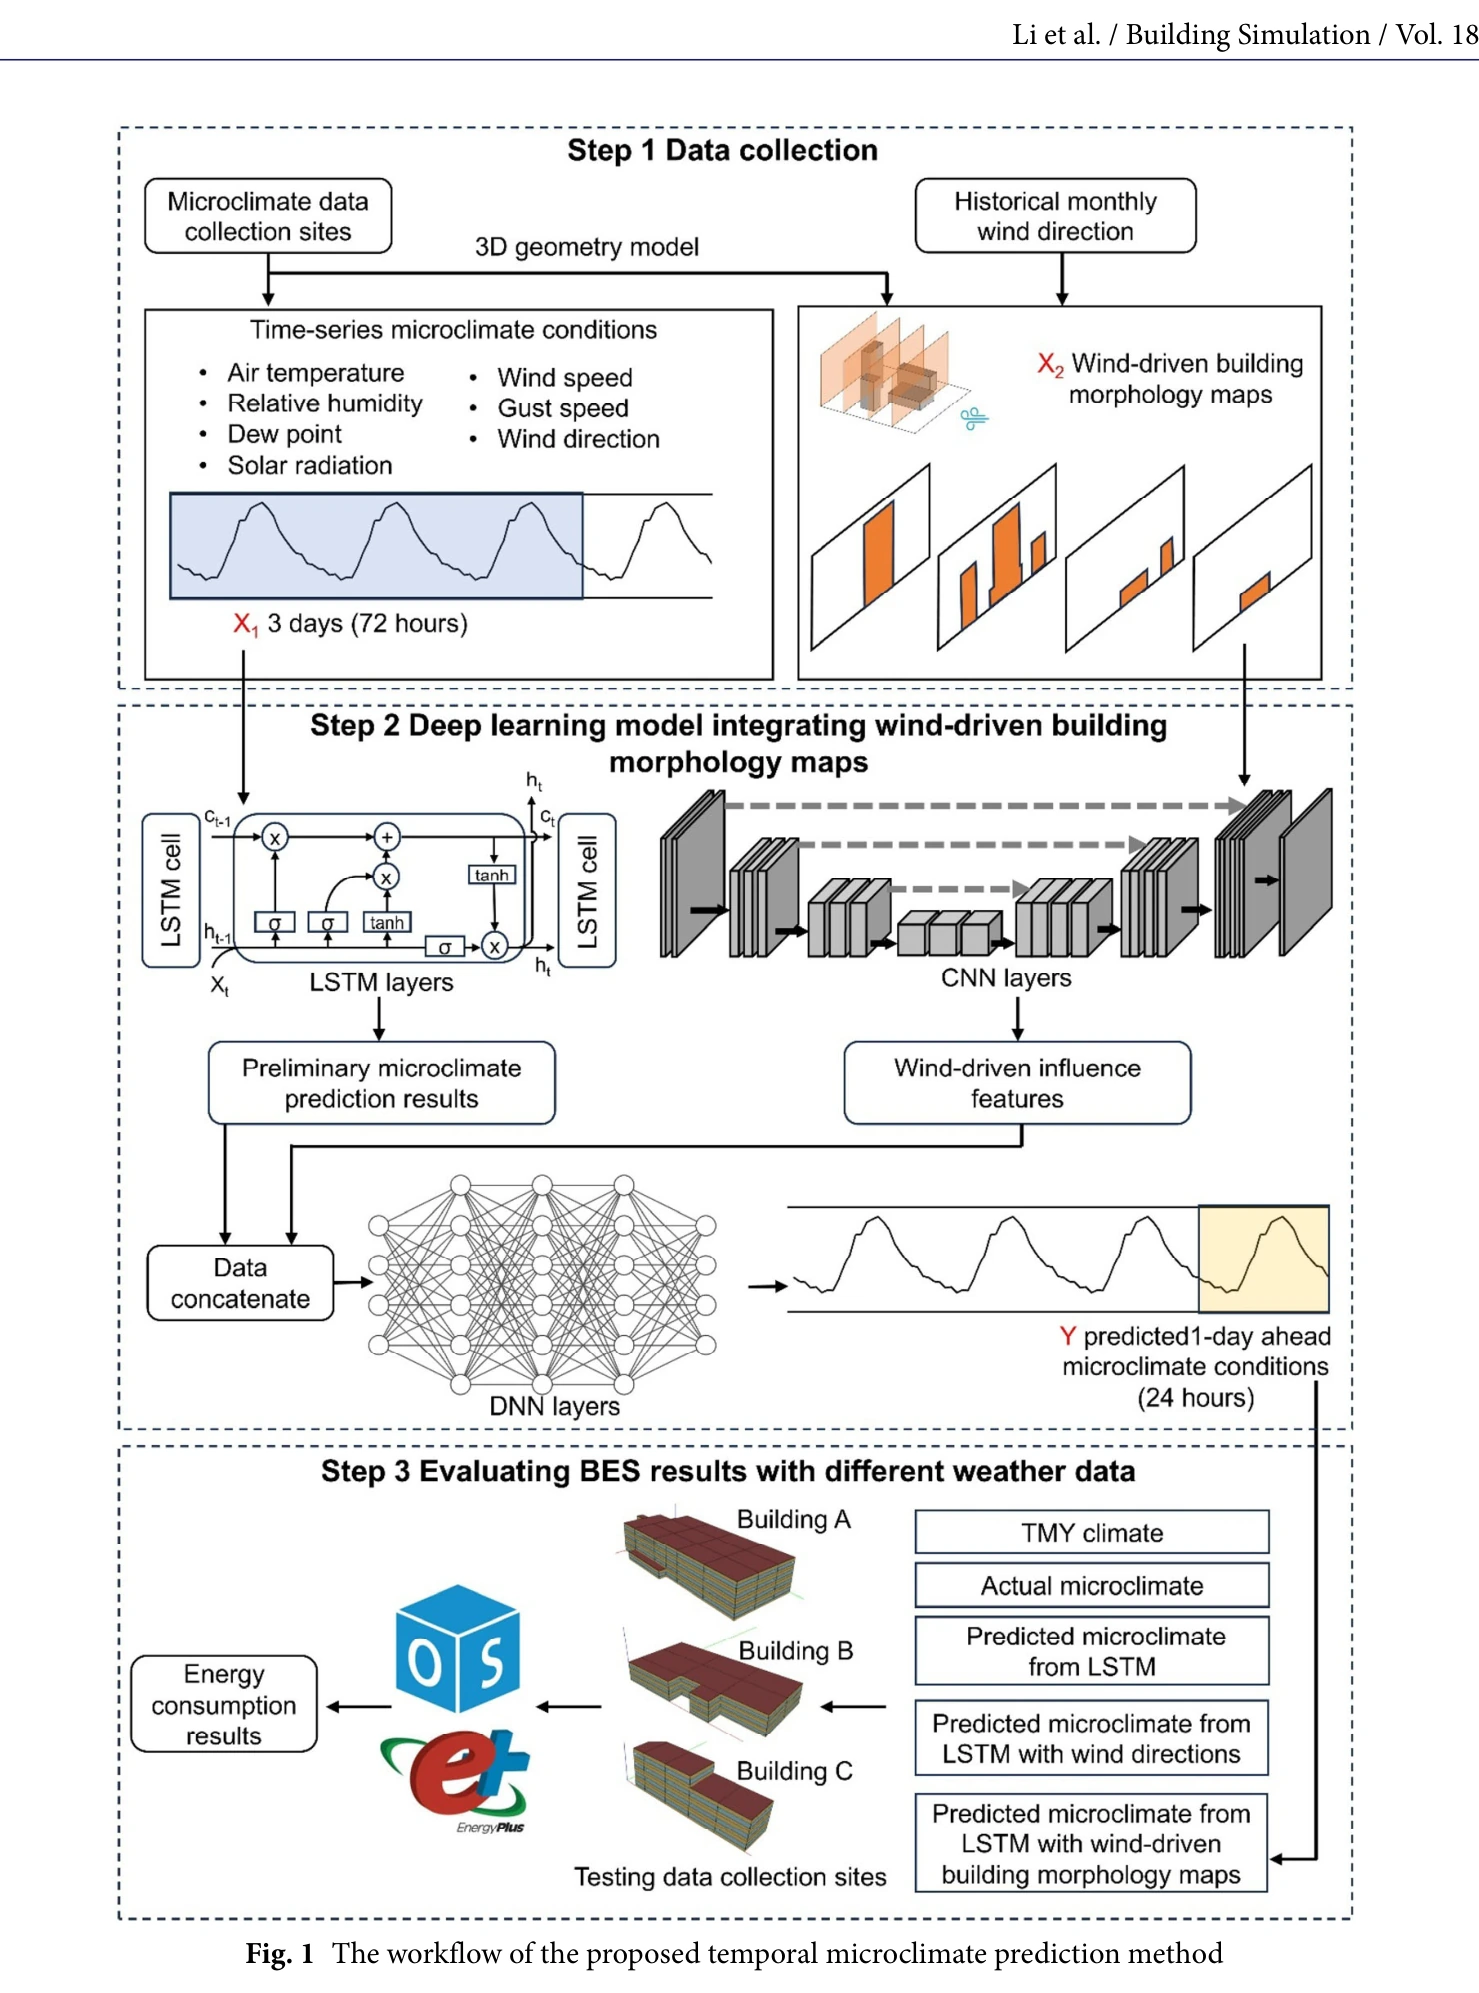
Figure 1. Workflow for temporal microclimate prediction using wind-driven building morphology maps and subsequent building-energy simulation.
Li et al. · Building Simulation 2025 · DOI 10.1007/s12273-025-1365-0
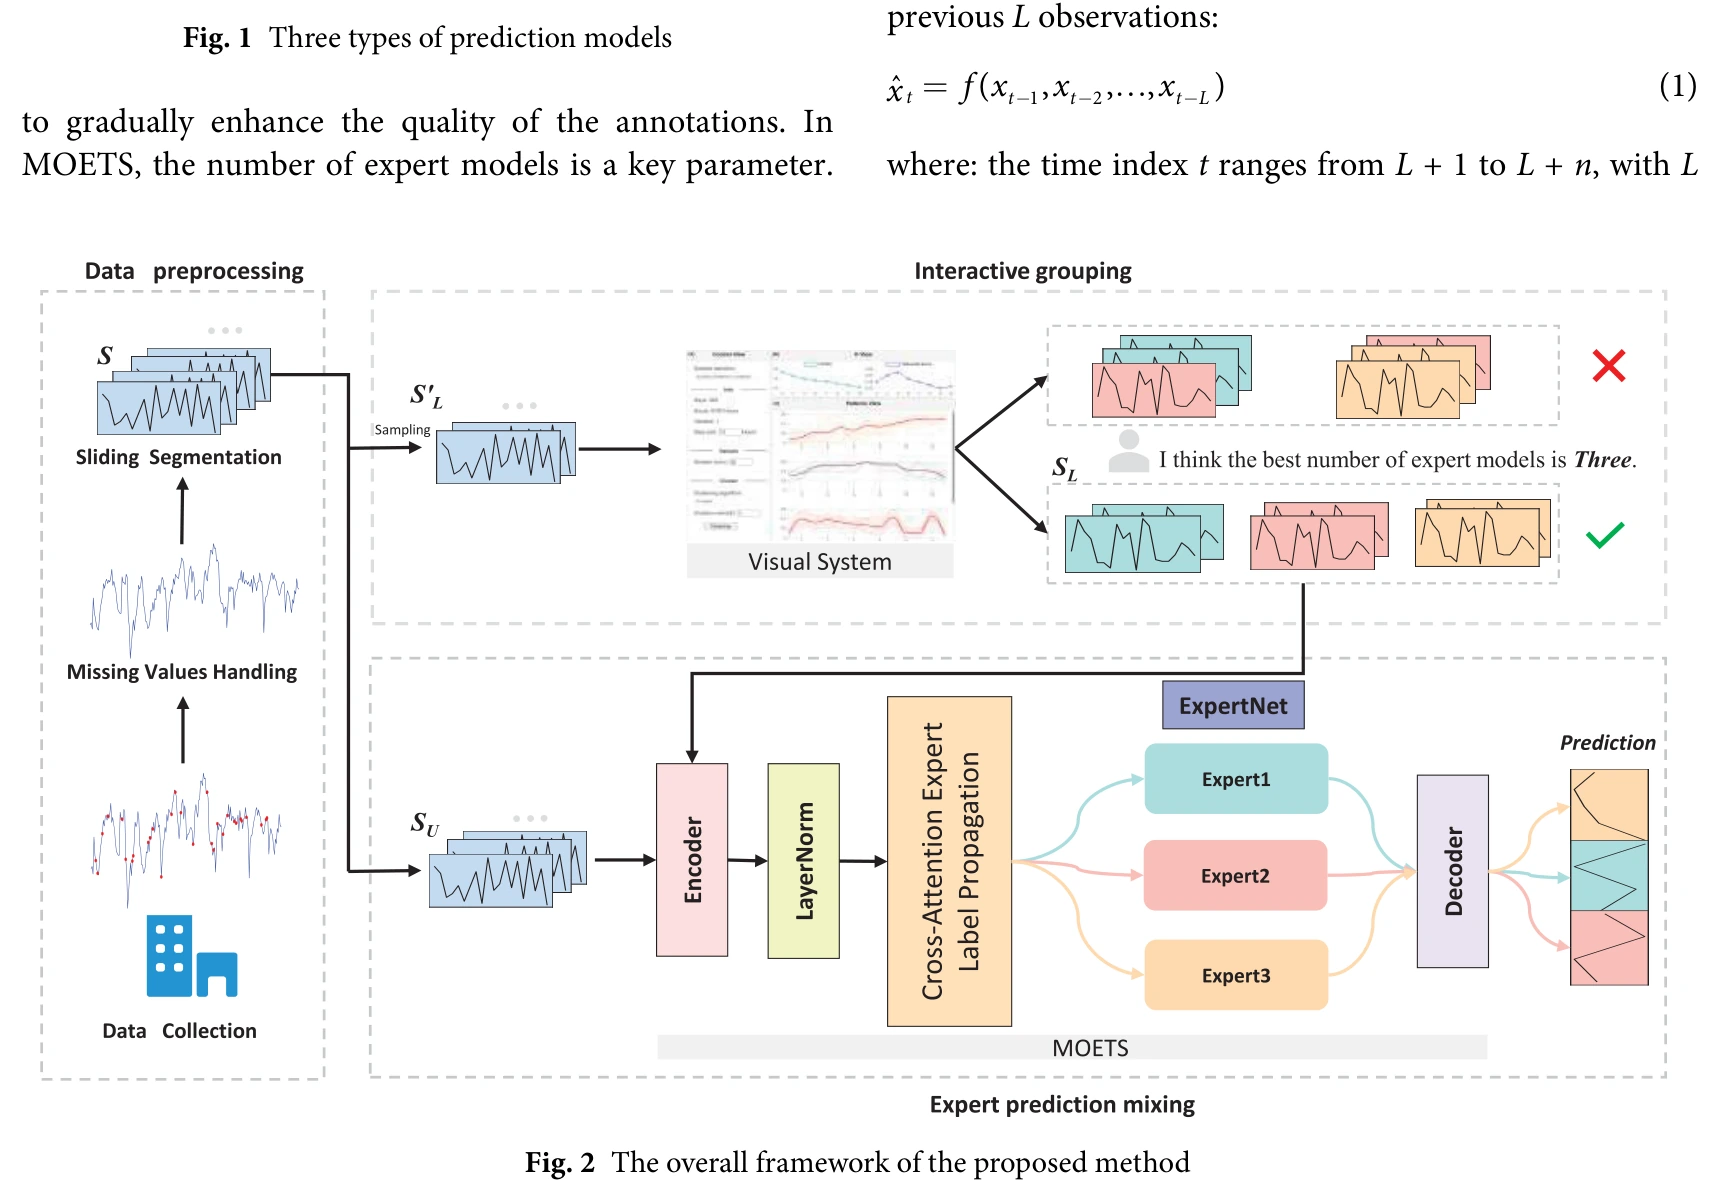
Figure 2. Overall MOETS framework with data preprocessing, interactive expert grouping, expert selection, and prediction mixing.
Tan et al. · Building Simulation 2025 · DOI 10.1007/s12273-025-1334-7
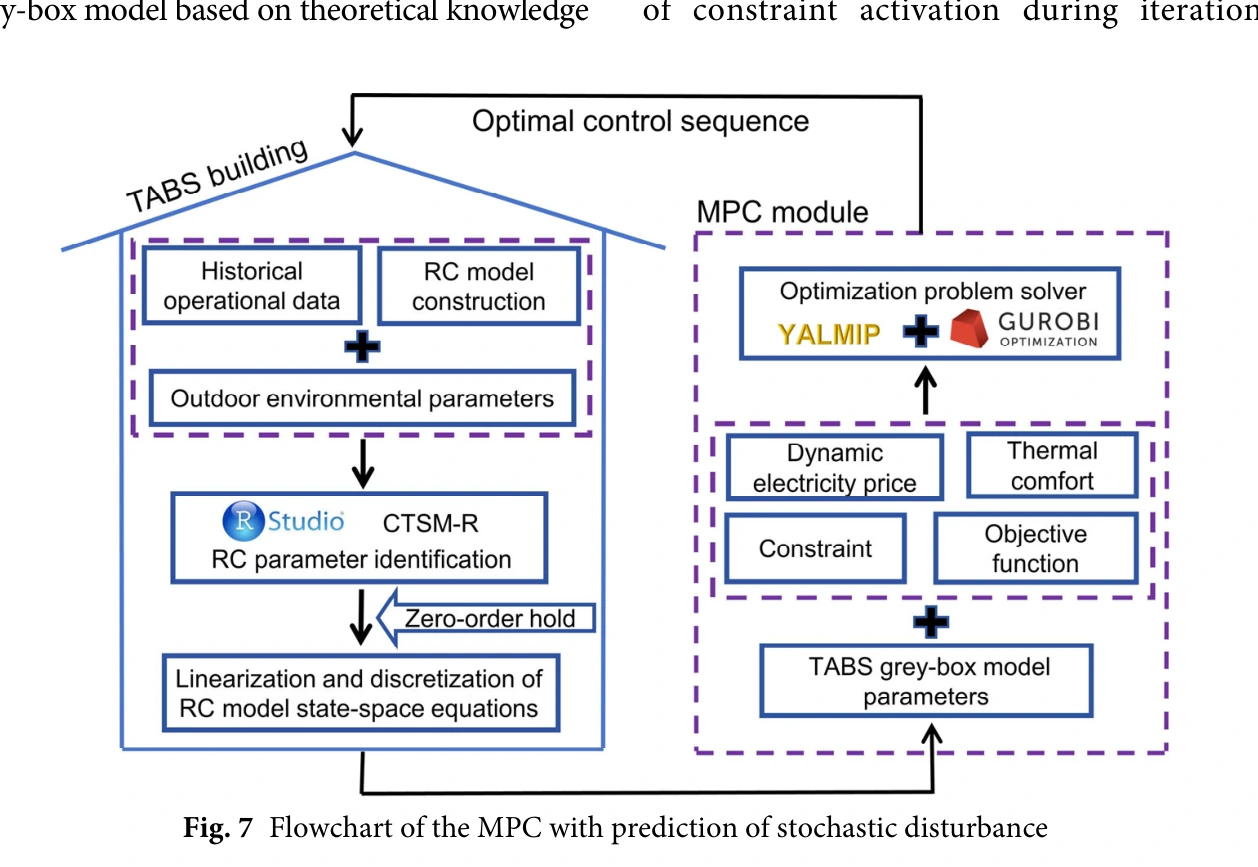
Figure 7. Flowchart of the MPC framework integrating a TABS grey-box model with stochastic disturbance prediction.
Yang et al. · Building Simulation 2025 · DOI 10.1007/s12273-025-1338-3
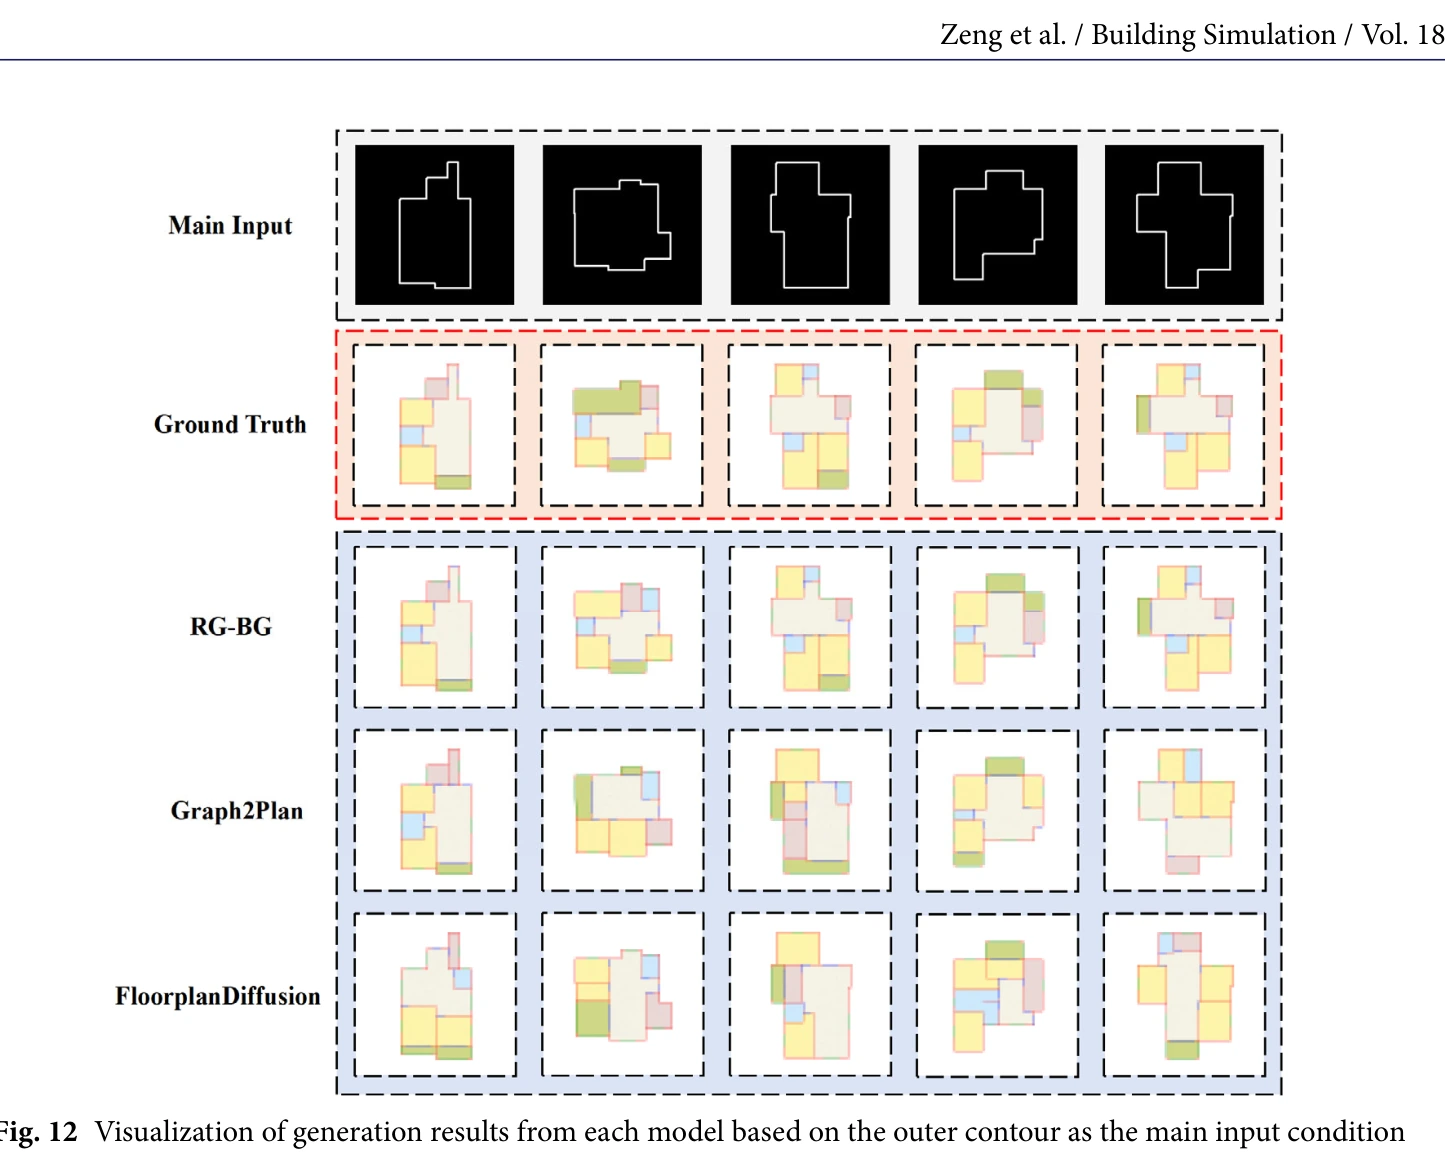
Figure 12. Comparison of generated residential floor plans under fixed outer-contour input conditions.
Zeng et al. · Building Simulation 2025 · DOI 10.1007/s12273-025-1337-4
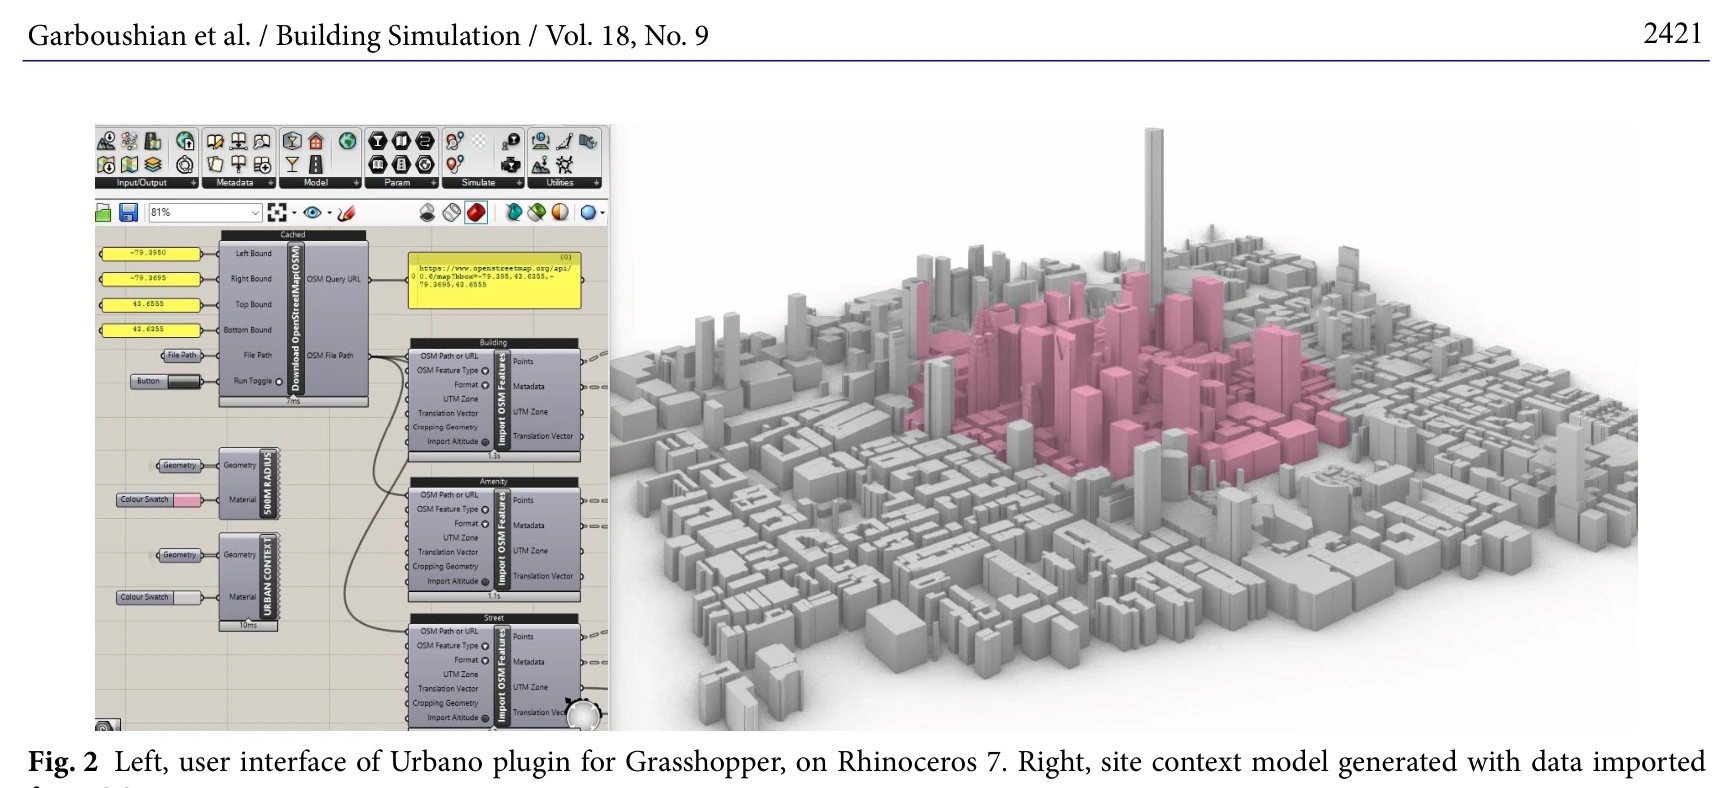
Figure 2. Urbano/Grasshopper workflow and the generated urban site-context model used in the adaptive-reuse analysis.
Garboushian et al. · Building Simulation 2025 · DOI 10.1007/s12273-025-1310-2
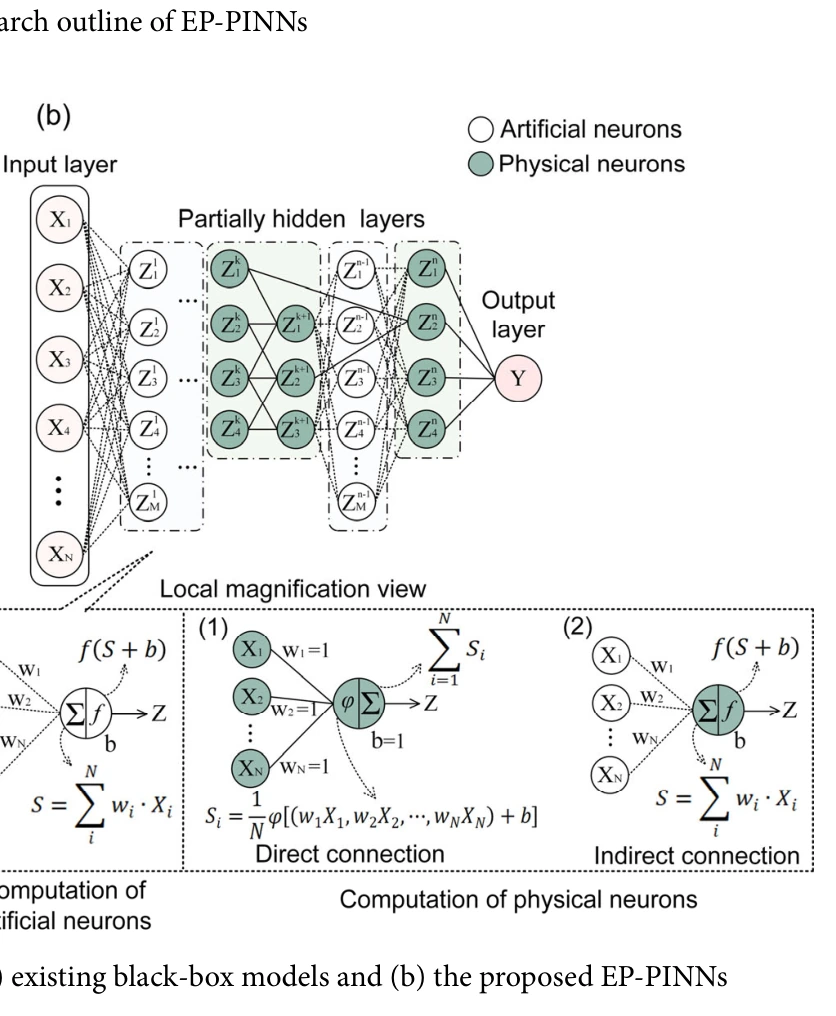
Figure 3. Network-architecture comparison between conventional black-box models and EP-PINNs with embedded physical neurons.
Fang et al. · Building Simulation 2025 · DOI 10.1007/s12273-025-1293-z
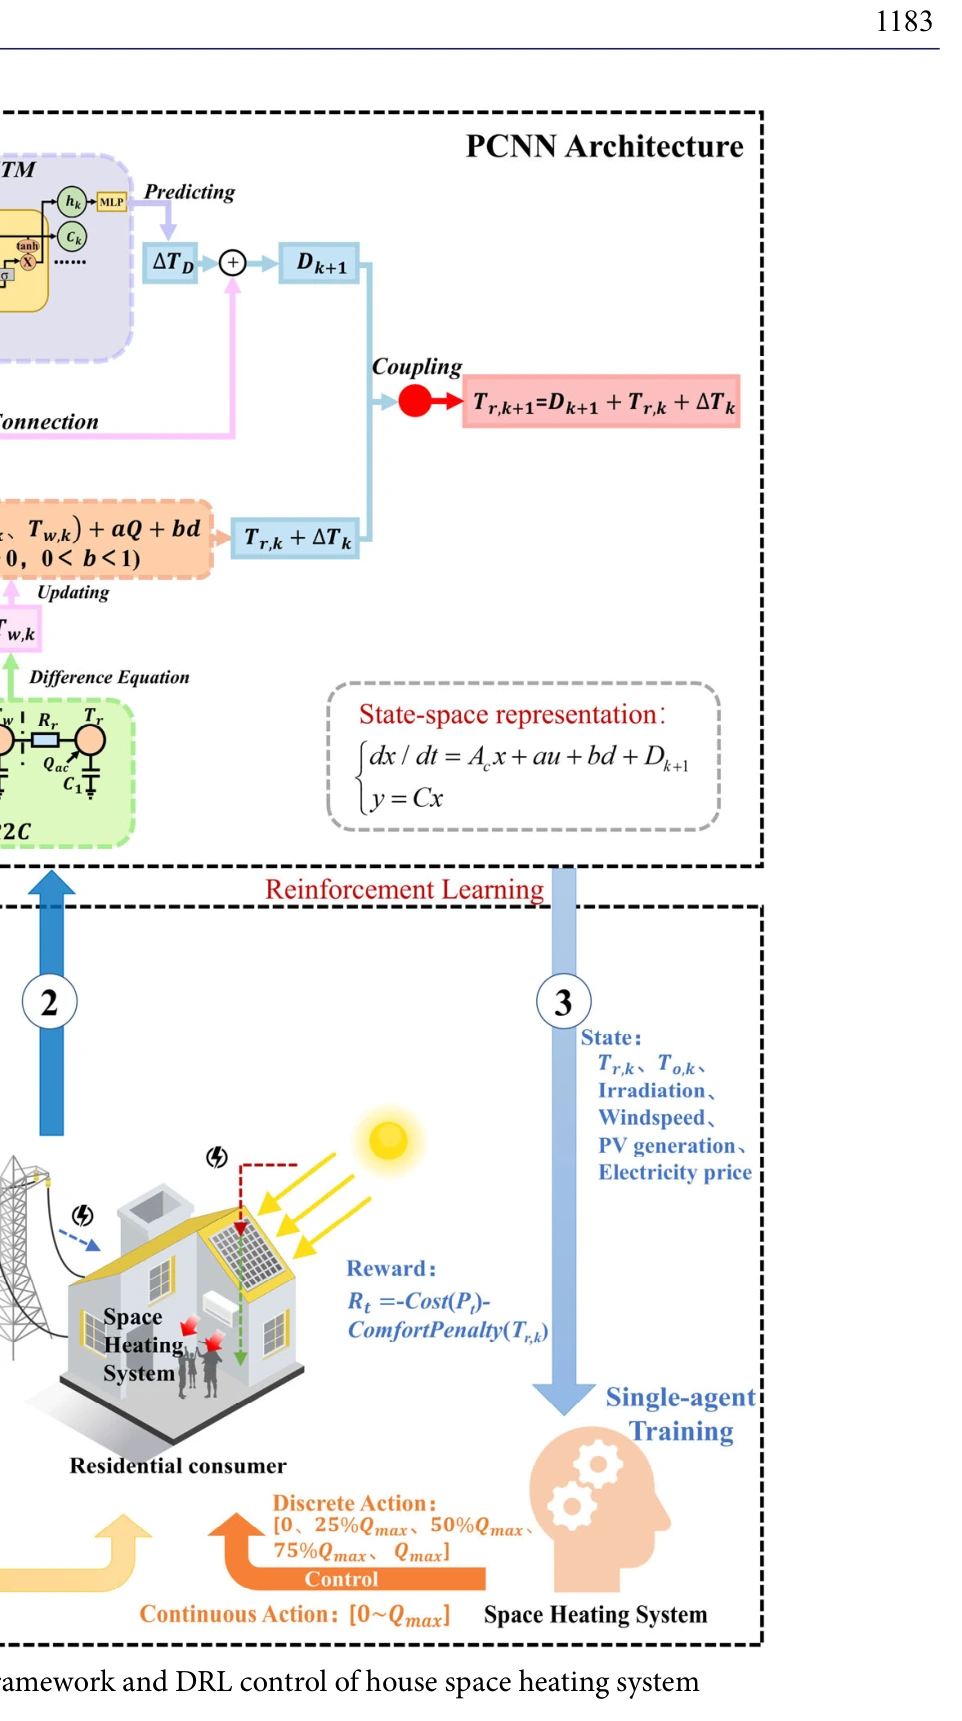
Figure 1. Proposed physically consistent neural network and deep-reinforcement-learning control framework for residential space heating.
Ran et al. · Building Simulation 2025 · DOI 10.1007/s12273-025-1253-7
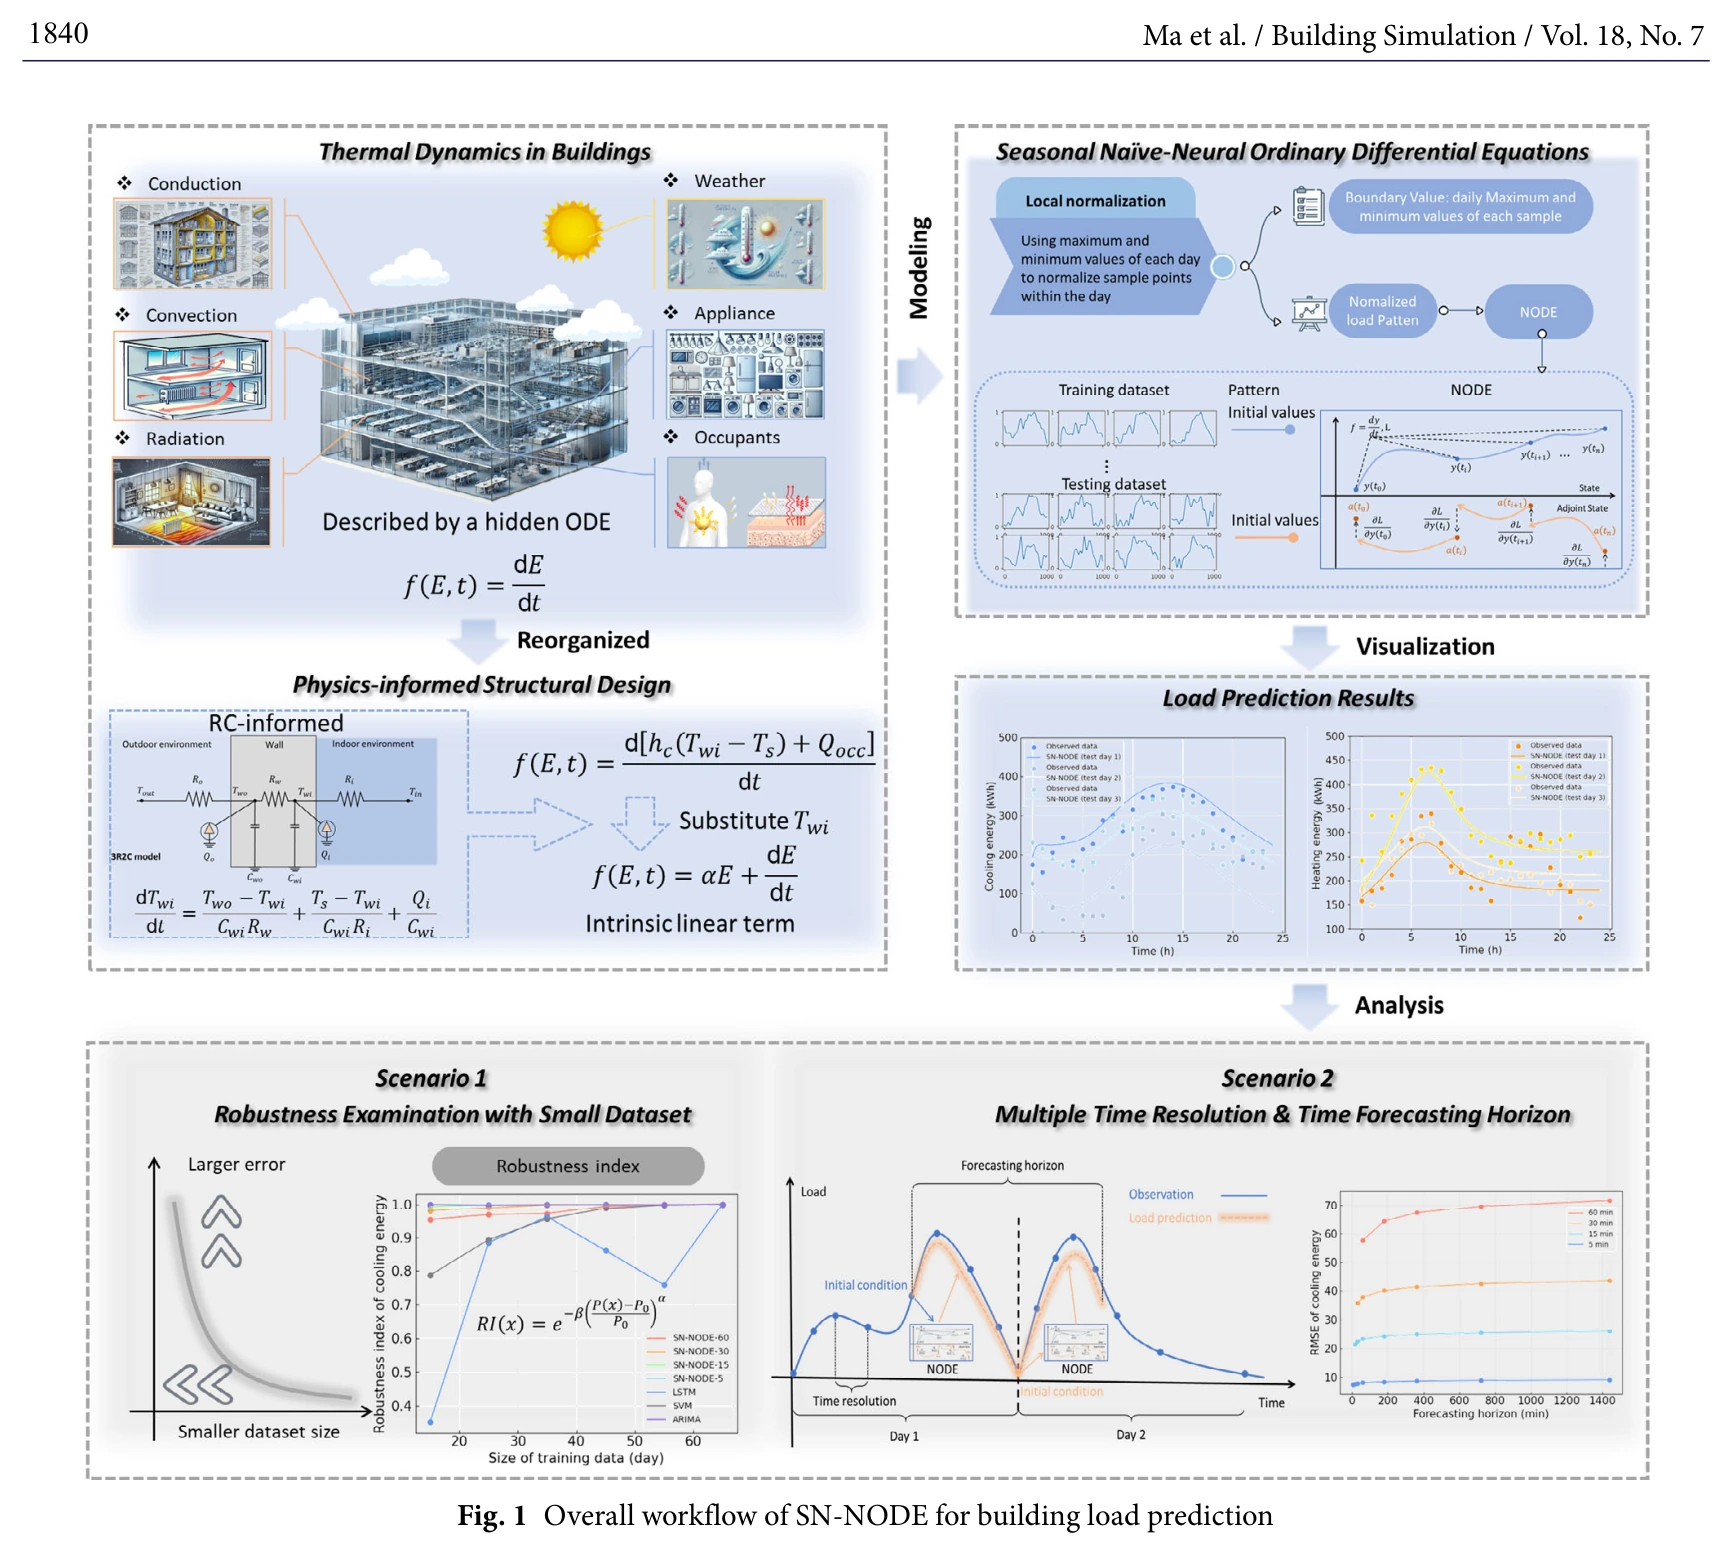
Figure 1. Overall workflow of SN-NODE for building-load prediction, robustness analysis, and multi-resolution forecasting.
Ma et al. · Building Simulation 2025 · DOI 10.1007/s12273-025-1269-z
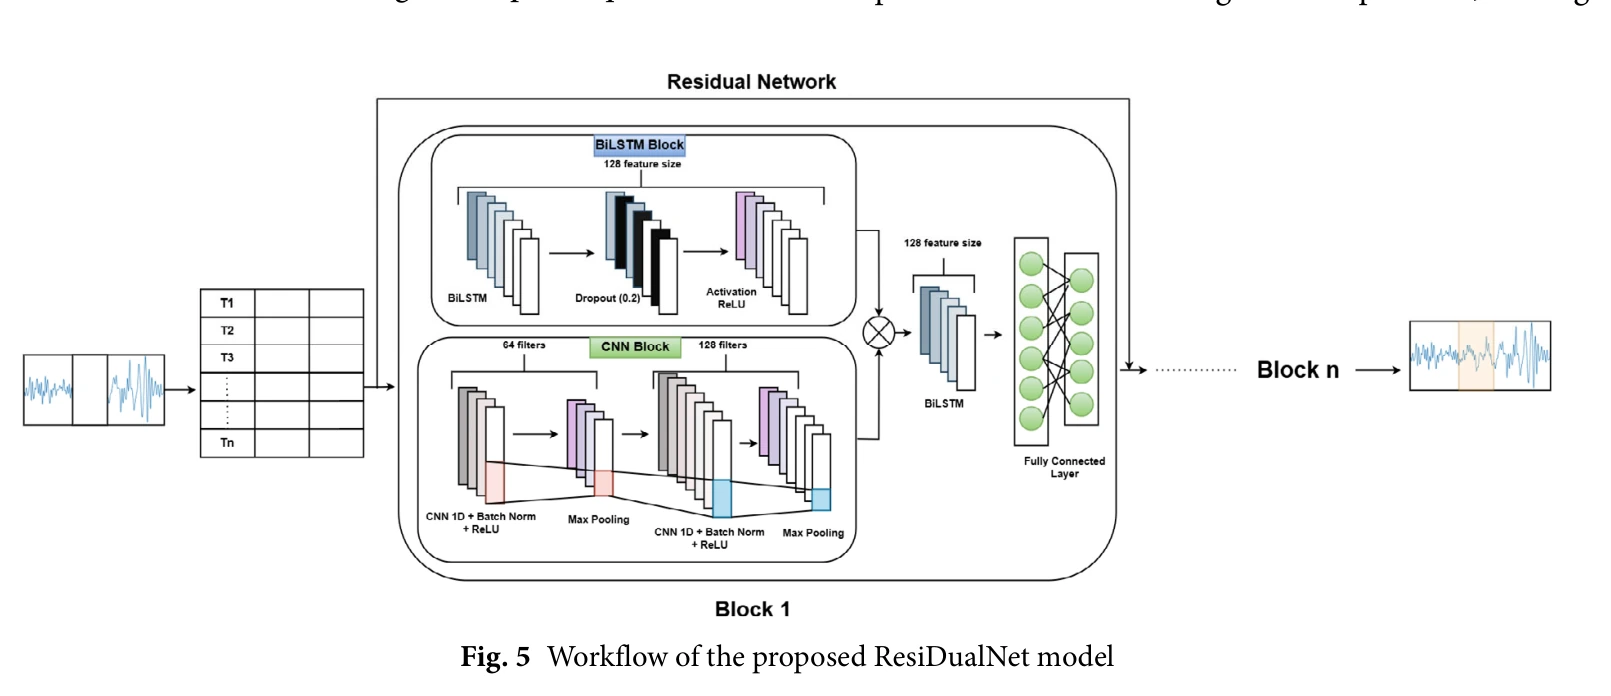
Figure 5. Workflow of the proposed ResiDualNet model for electric-vehicle charging-data imputation.
Fahim et al. · Building Simulation 2025 · DOI 10.1007/s12273-025-1236-8
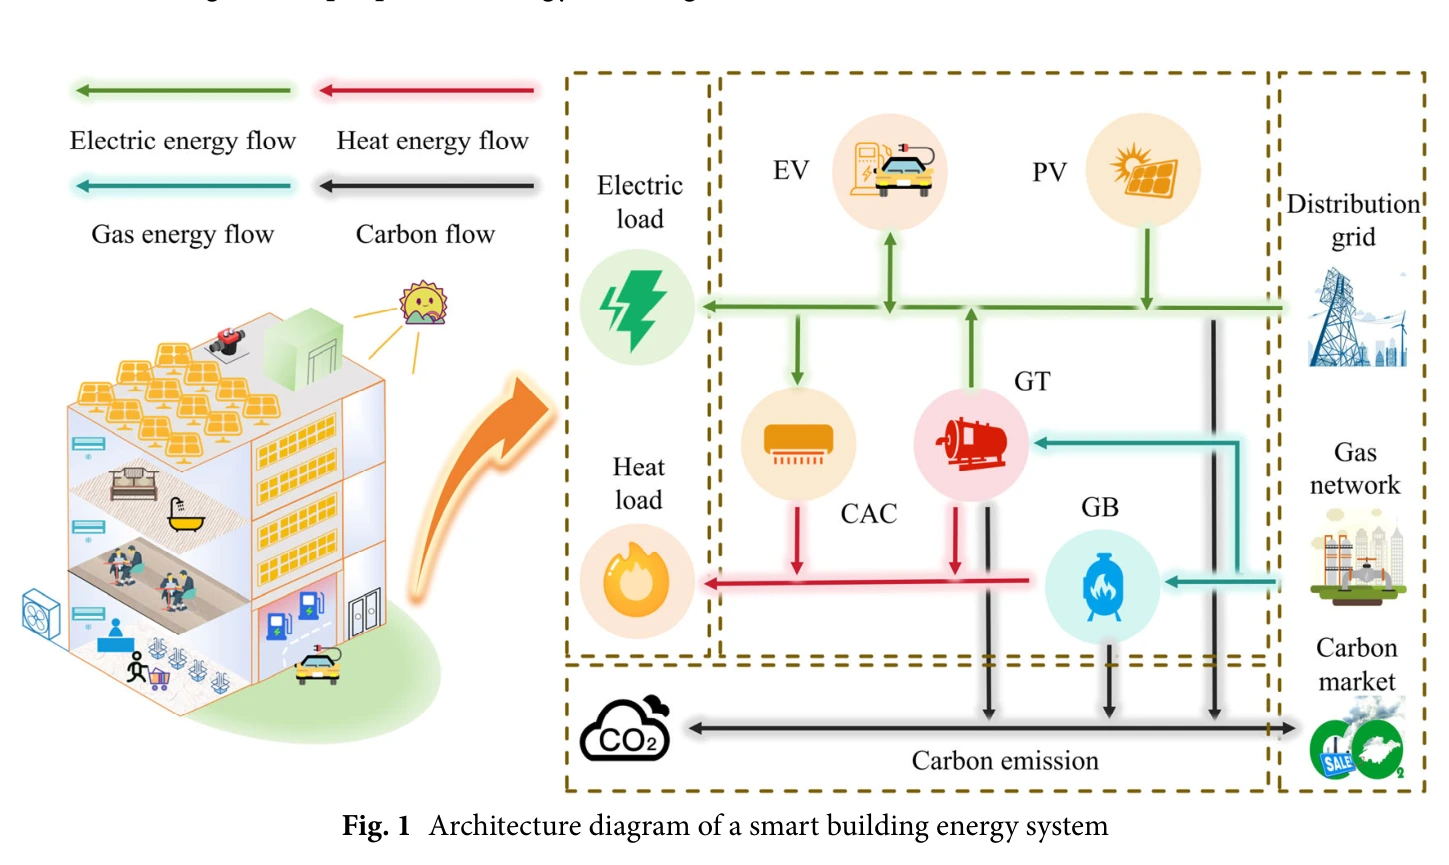
Figure 1. Architecture of a smart building energy system integrating electric loads, EVs, PV, thermal equipment, and external grids.
Zhao et al. · Building Simulation 2025 · DOI 10.1007/s12273-024-1219-1
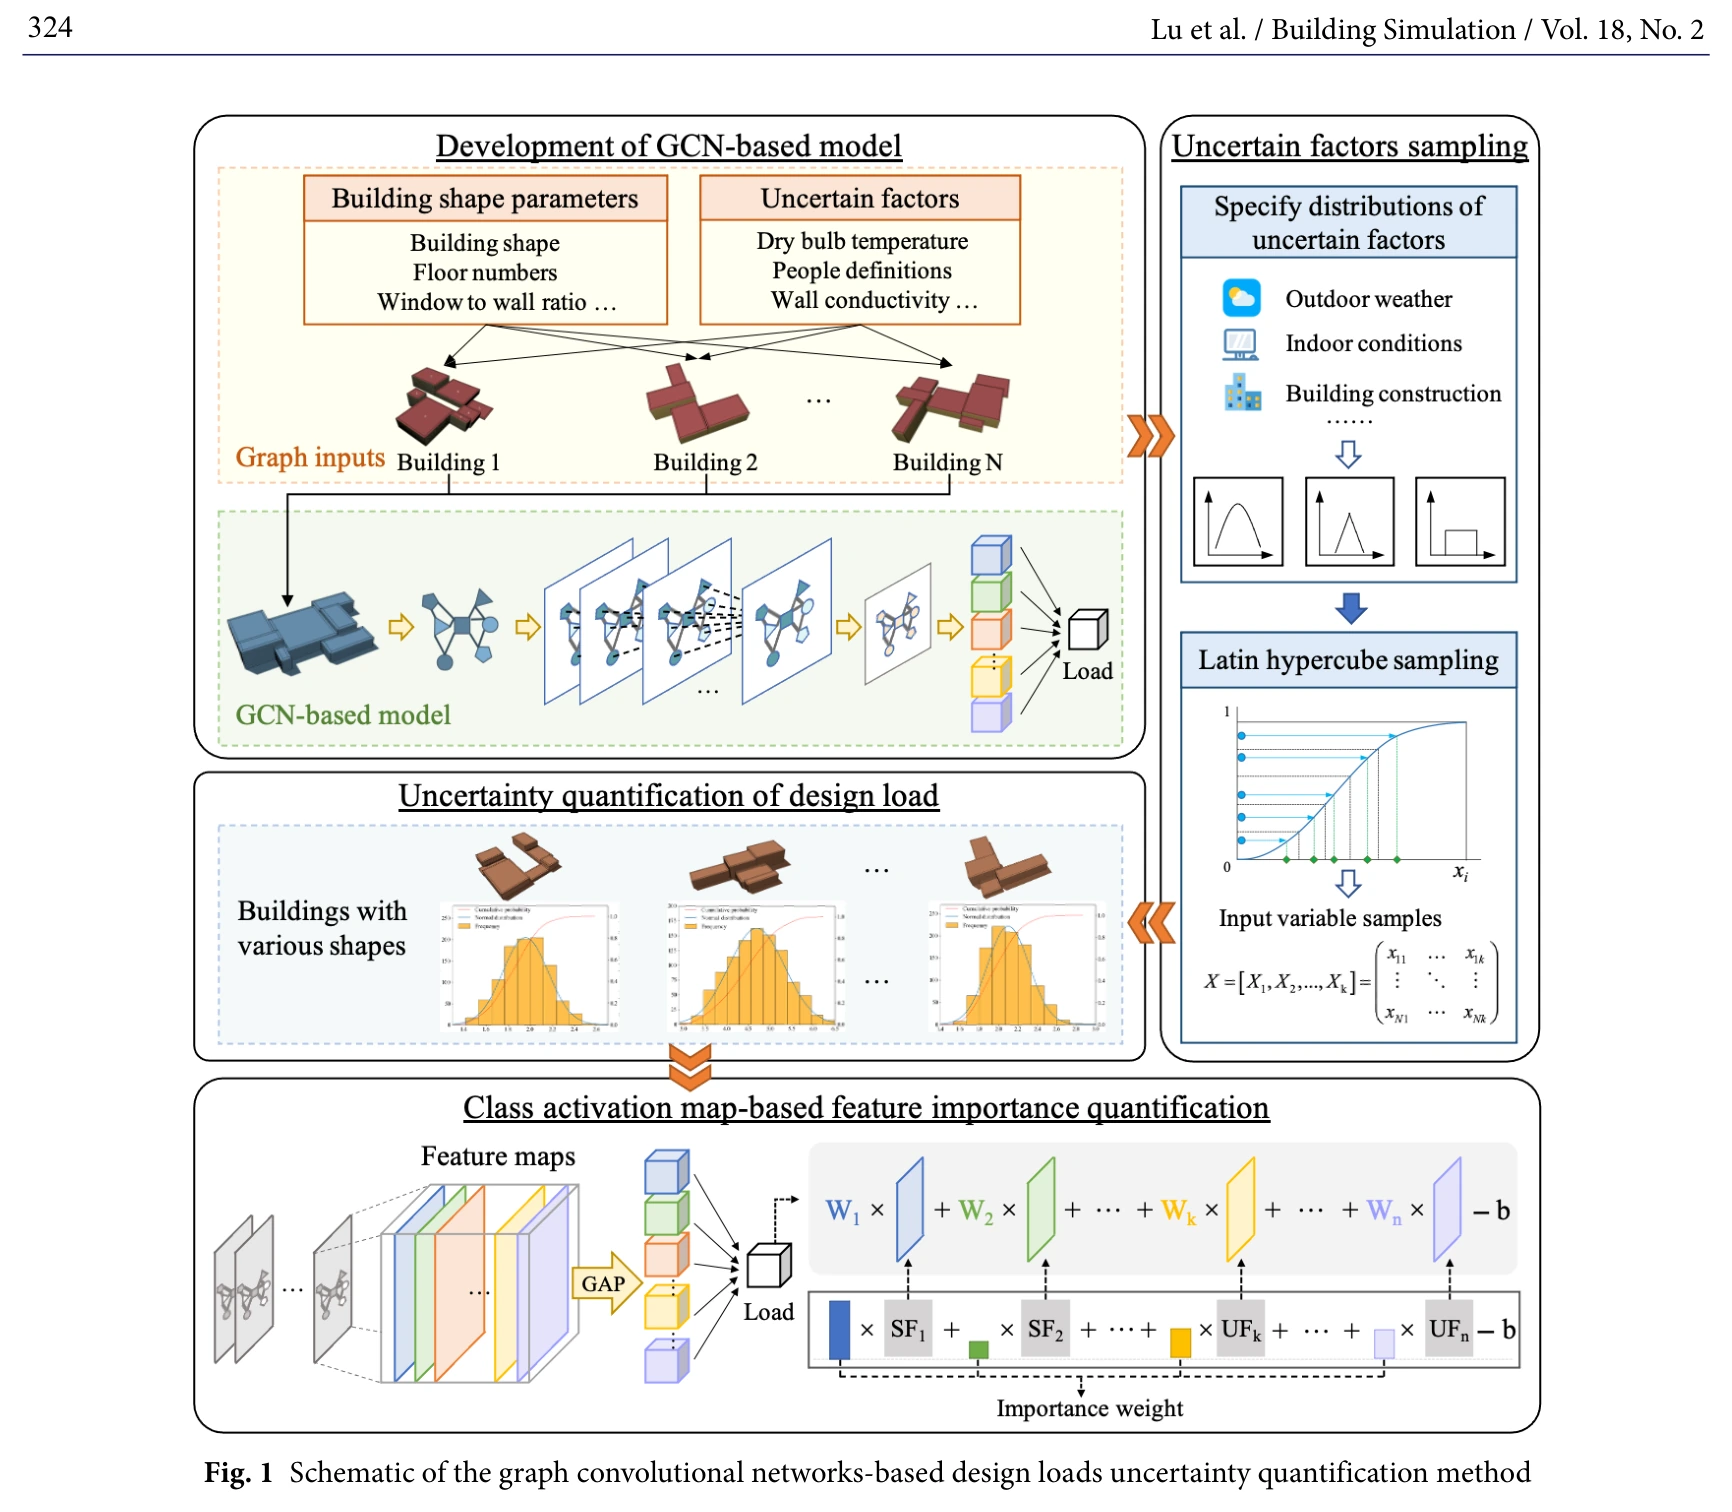
Figure 1. GCN-based design-load uncertainty-quantification method, including graph construction, uncertain-factor sampling, and CAM interpretation.
Lu et al. · Building Simulation 2025 · DOI 10.1007/s12273-024-1212-8